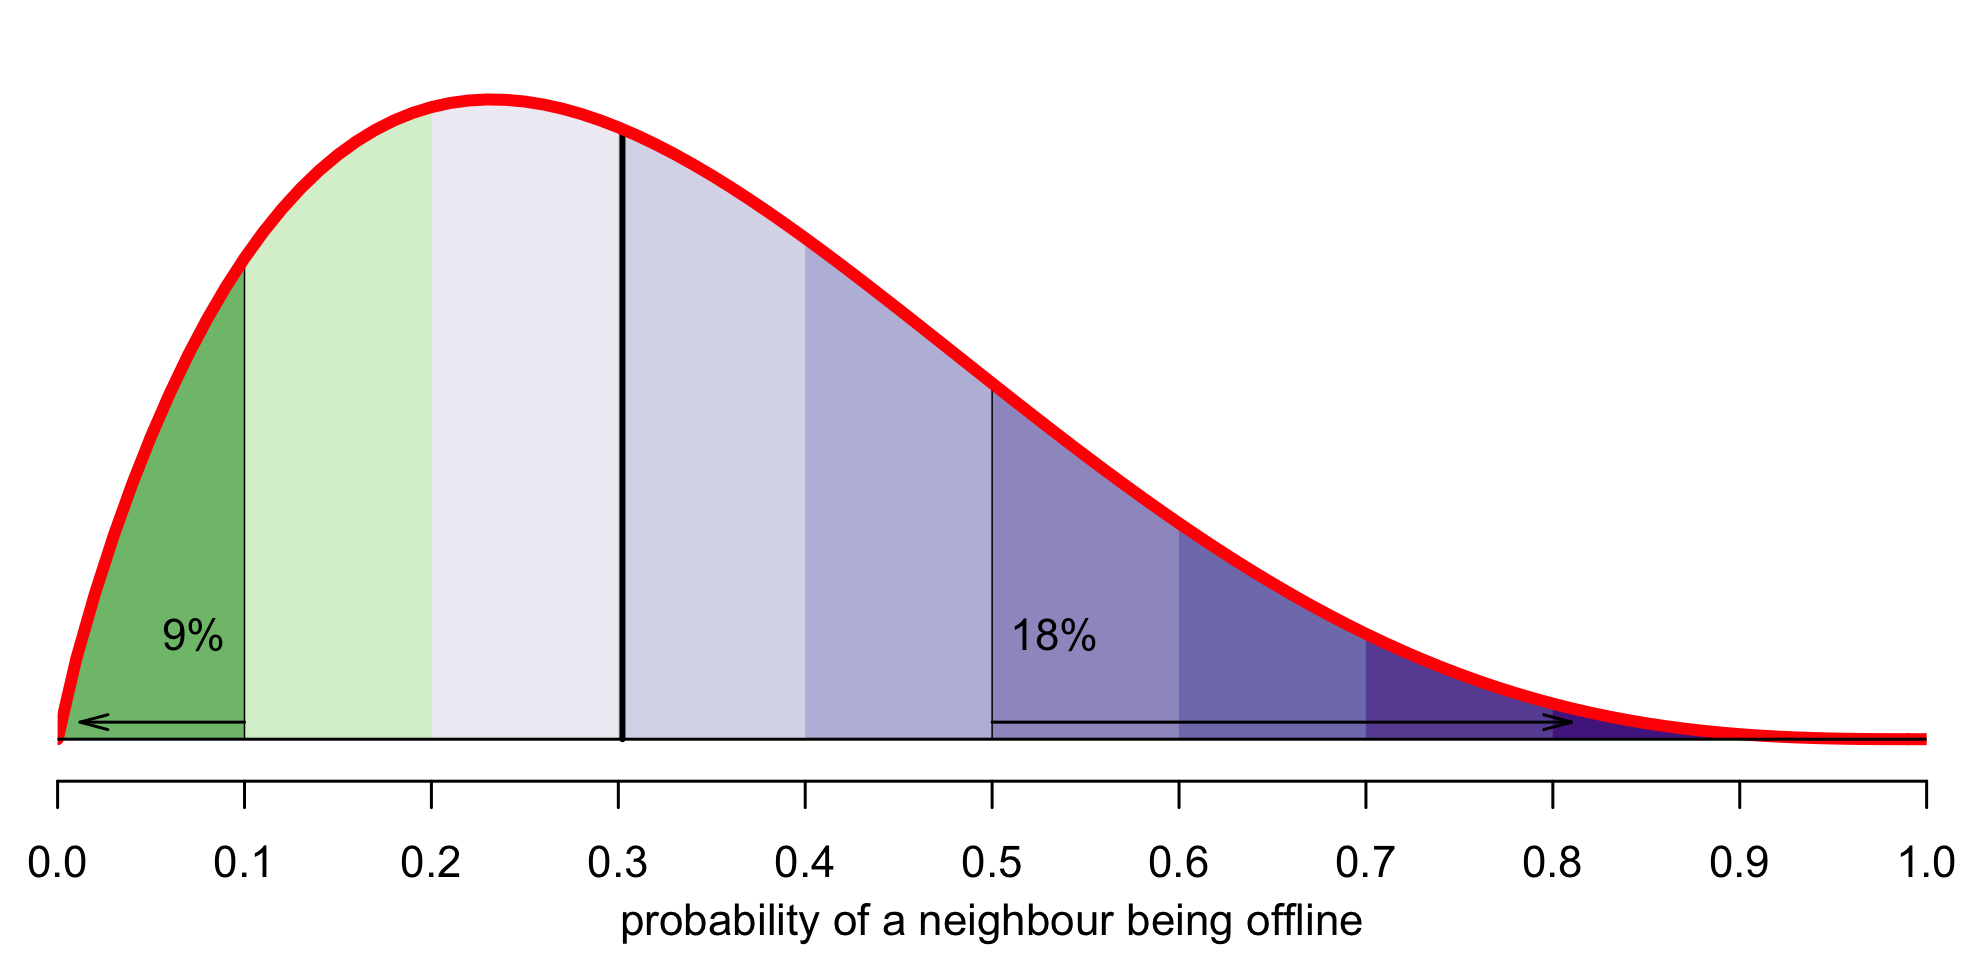
This figure shows bands of inclusion/exclusion, for the postcode-level model introduced in Figure 1.6 and Figure III.1

We colour each band. The green band representing housholds in postcodes where the chance of being offline is less than 10% occupies 9% of the area under the curve, representing 9% of households in Scotland.
The purple bands representing housholds in postcodes where most households are offline — the chance of being offline is more than 50% — occupies 18% of the area under the curve, representing 18% of households in Scotland.
Together, these extremes in inclusion and exclusion account for 27% of households in Scotland.
The models are produced using the following code
## fit a beta binomial distribution to the postcode level data
pcglm <-
    vglm(formula =
         cbind(offline, connected)
         ~ 1,
         family = betabinomial.ab,
         data = model,
         trace = TRUE
         )
## fit a beta binomial distribution to the datazone level data
dzglm <-
    vglm(formula =
         cbind(offline, connected)
         ~ 1,
         family = betabinomial.ab,
         data = subset(dz,households > 1),
         trace = TRUE
         )