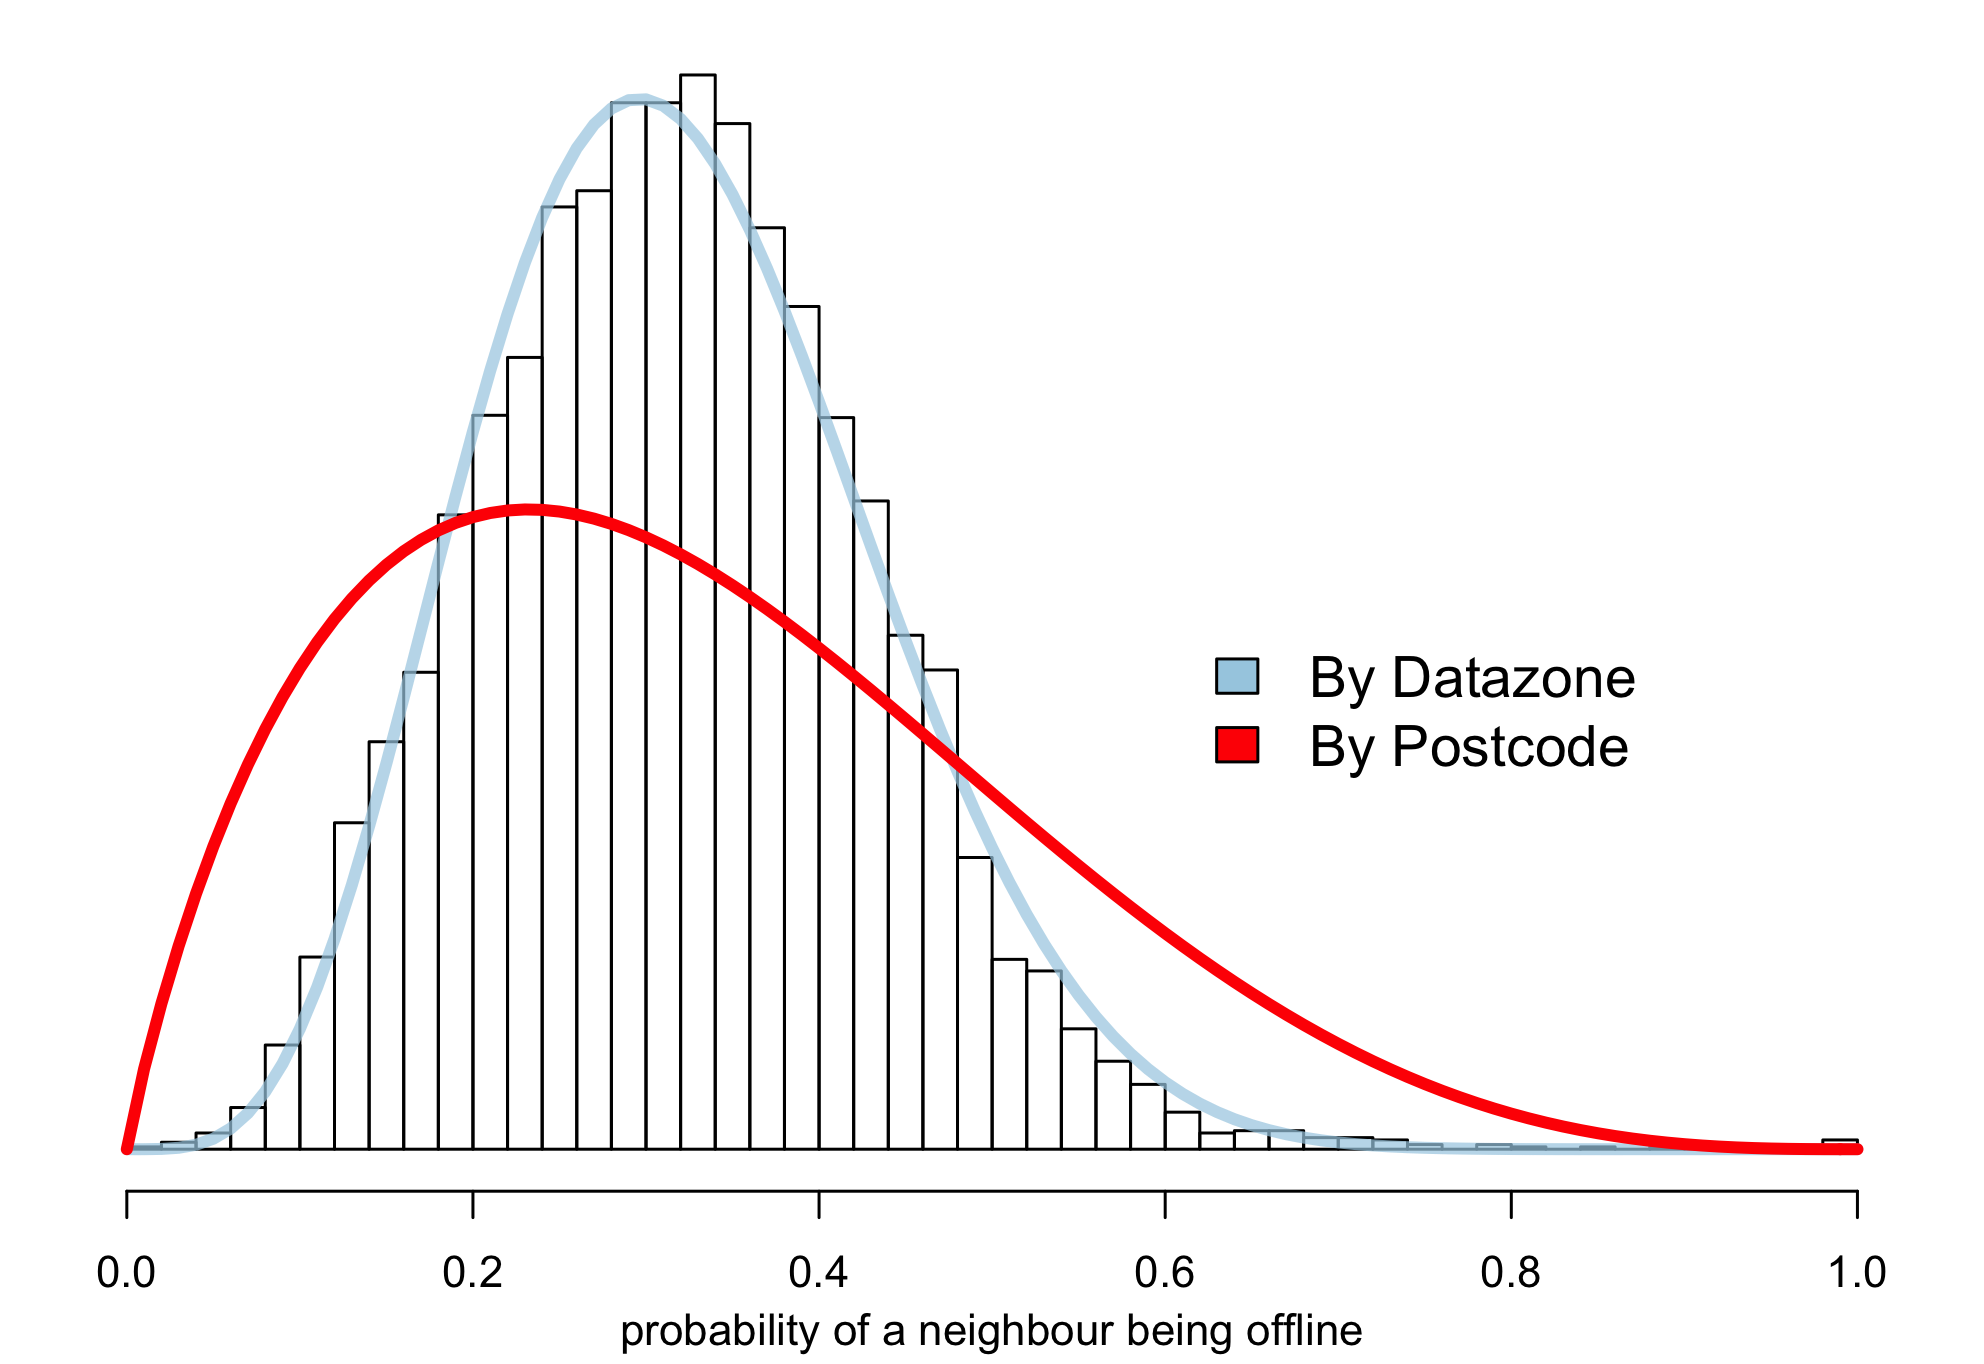
This figure compares the distribution of the probability of being offline across datazones with that across postcodes.

We fit a beta-binomial distribution to both the
postcode
and datazone datasets,
using the
VGAM package in R. The first of these is already shown in Figure 1.6 .
We plot both models, together with a histogram of the observed proportions of households offline in each datazone.
We do not plot a similar histogram for postcodes, as the small numbers of households in many postcodes (more than 25% of postcodes include five or fewer households) mean that, at postcode level, the observed proportion offline is subject to large variations from the underlying probability.
The models are produced using the following code
## fit a beta binomial distribution to the postcode level data
pcglm <-
    vglm(formula =
         cbind(offline, connected)
         ~ 1,
         family = betabinomial.ab,
         data = model,
         trace = TRUE
         )
## fit a beta binomial distribution to the datazone level data
dzglm <-
    vglm(formula =
         cbind(offline, connected)
         ~ 1,
         family = betabinomial.ab,
         data = subset(dz,households > 1),
         trace = TRUE
         )