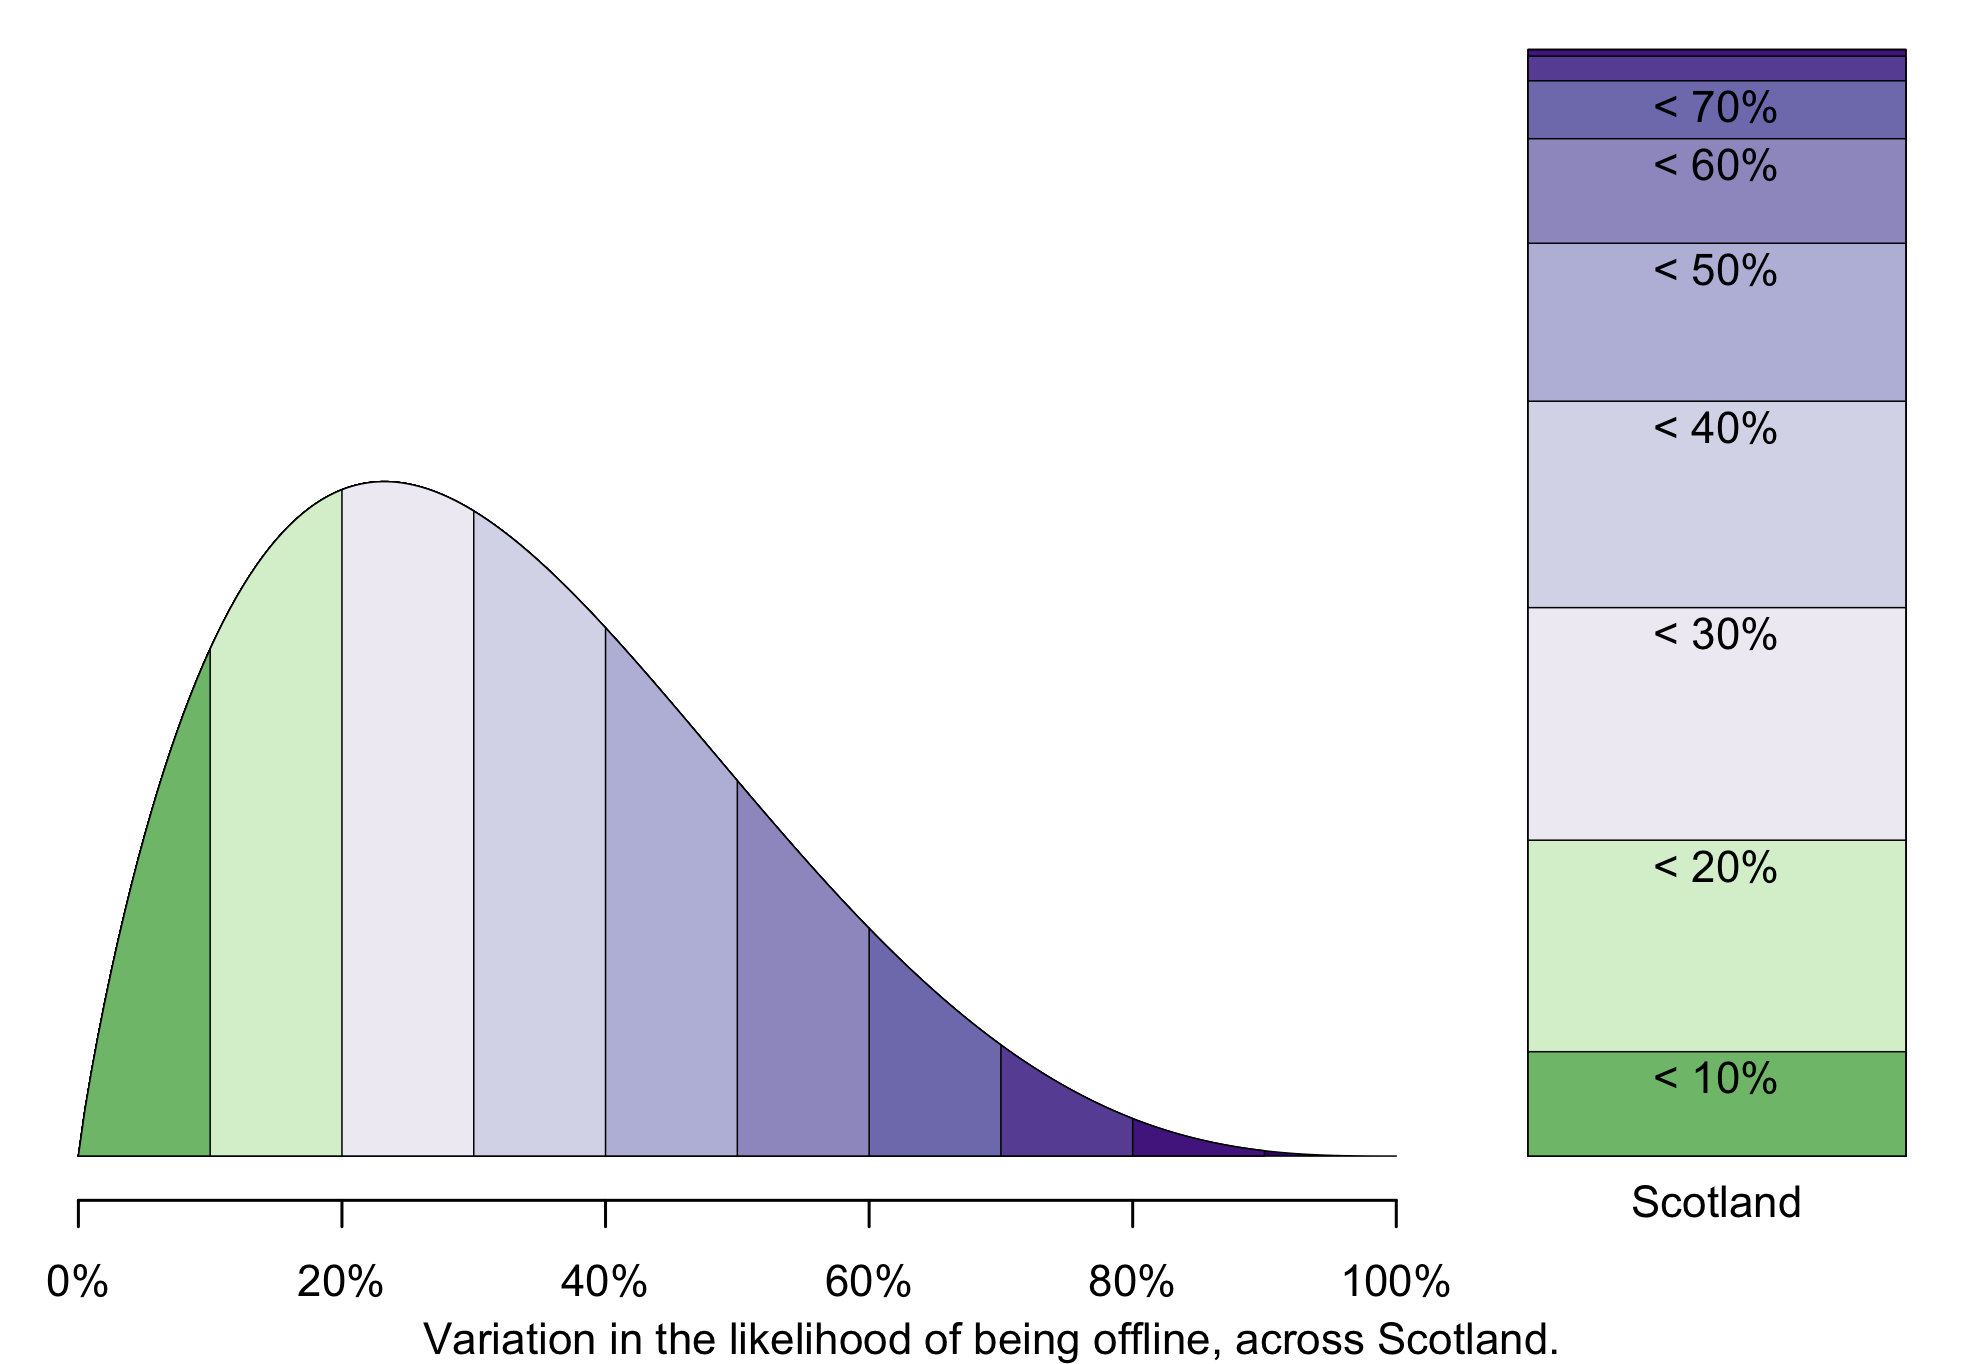
This figure shows how the proportion of households offline varies with isolation for four different sets of postcodes.

This figure shows our model of the distribution of the probability of being offline across postcodes.
We use the model dataset,
and fit the two parameters of a beta-binomial distribution, using the
VGAM package in R.
The model is produced using the following code:
pcglm <-
    vglm(formula =
         cbind(offline, connected)
         ~ 1,
         family = betabinomial.ab,
         data = model,
         trace = TRUE
         )
The vertical scale used here is different from that used for this figure in the report. It is chosen to match figures III.1 and III.2 .