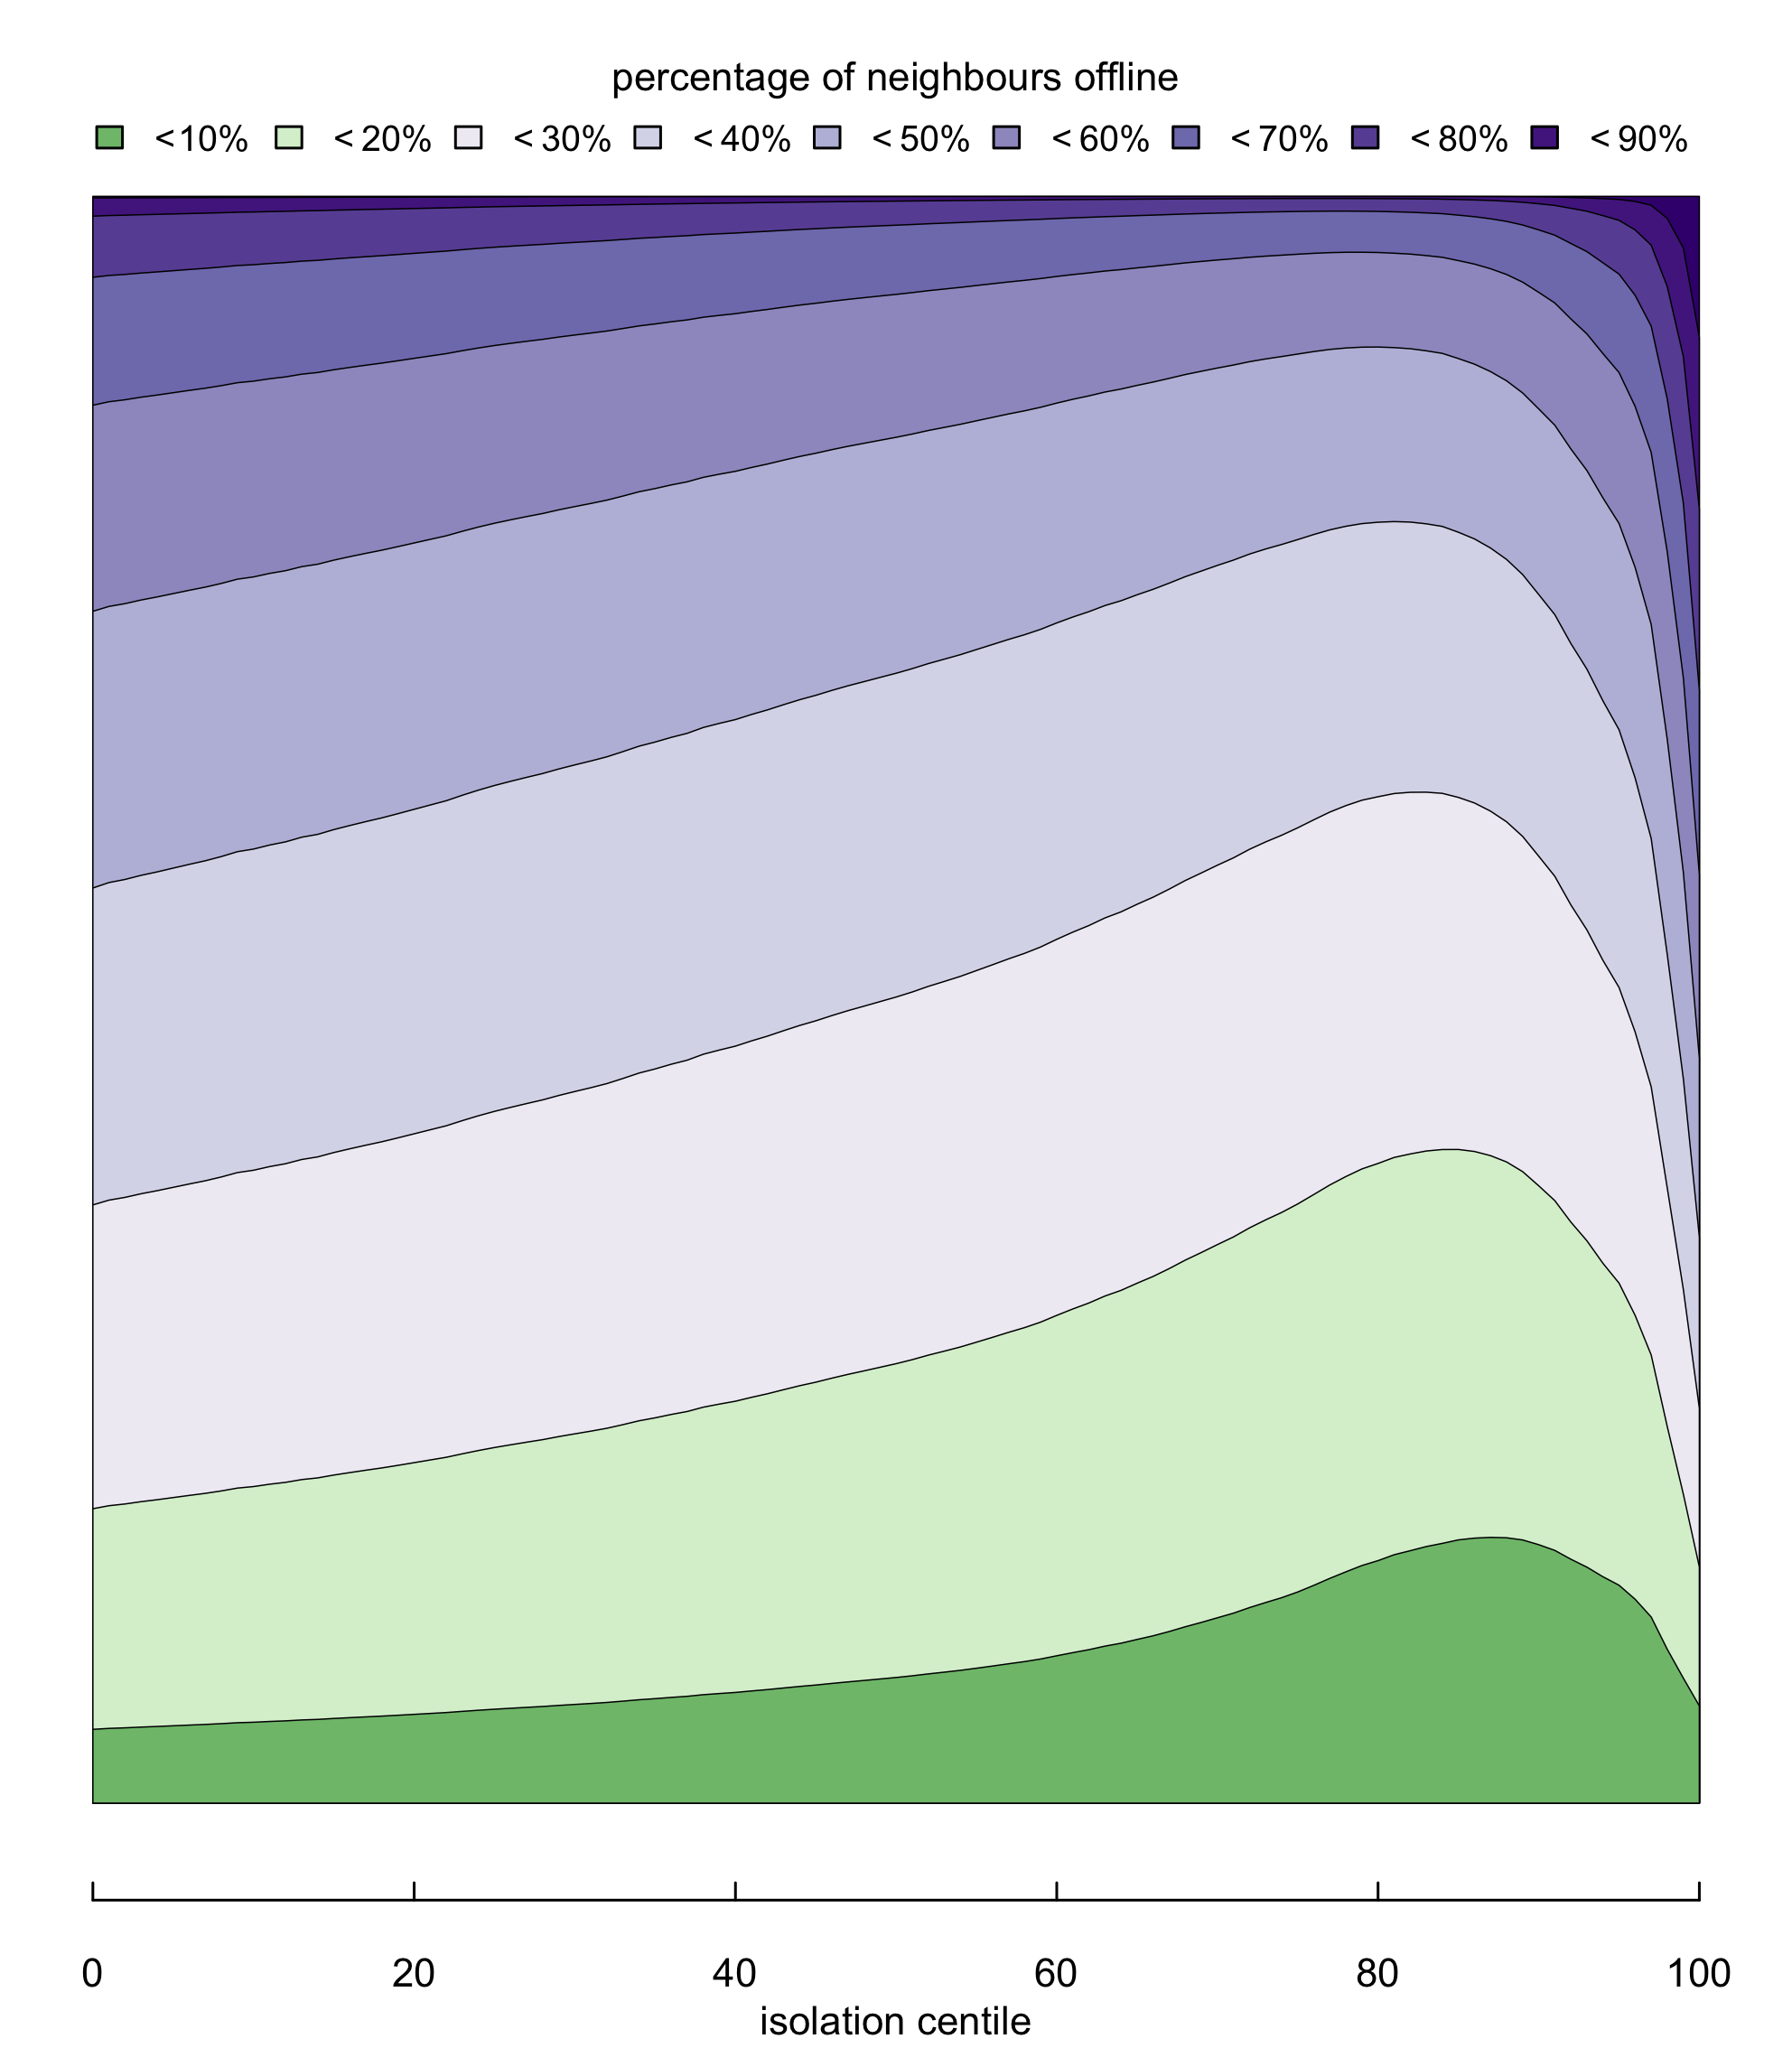
This plot is similar to Figure 1.7, but it distributes each inclusion/exclusion band over levels of isolation, rather than SIMD deprivation.

The model is produced using the following code:
isolgam <-
    vgam(formula =
         cbind(offline, connected)
         ~ s(isolation,df=6),
         family = betabinomial.ab,
         data = model
         )