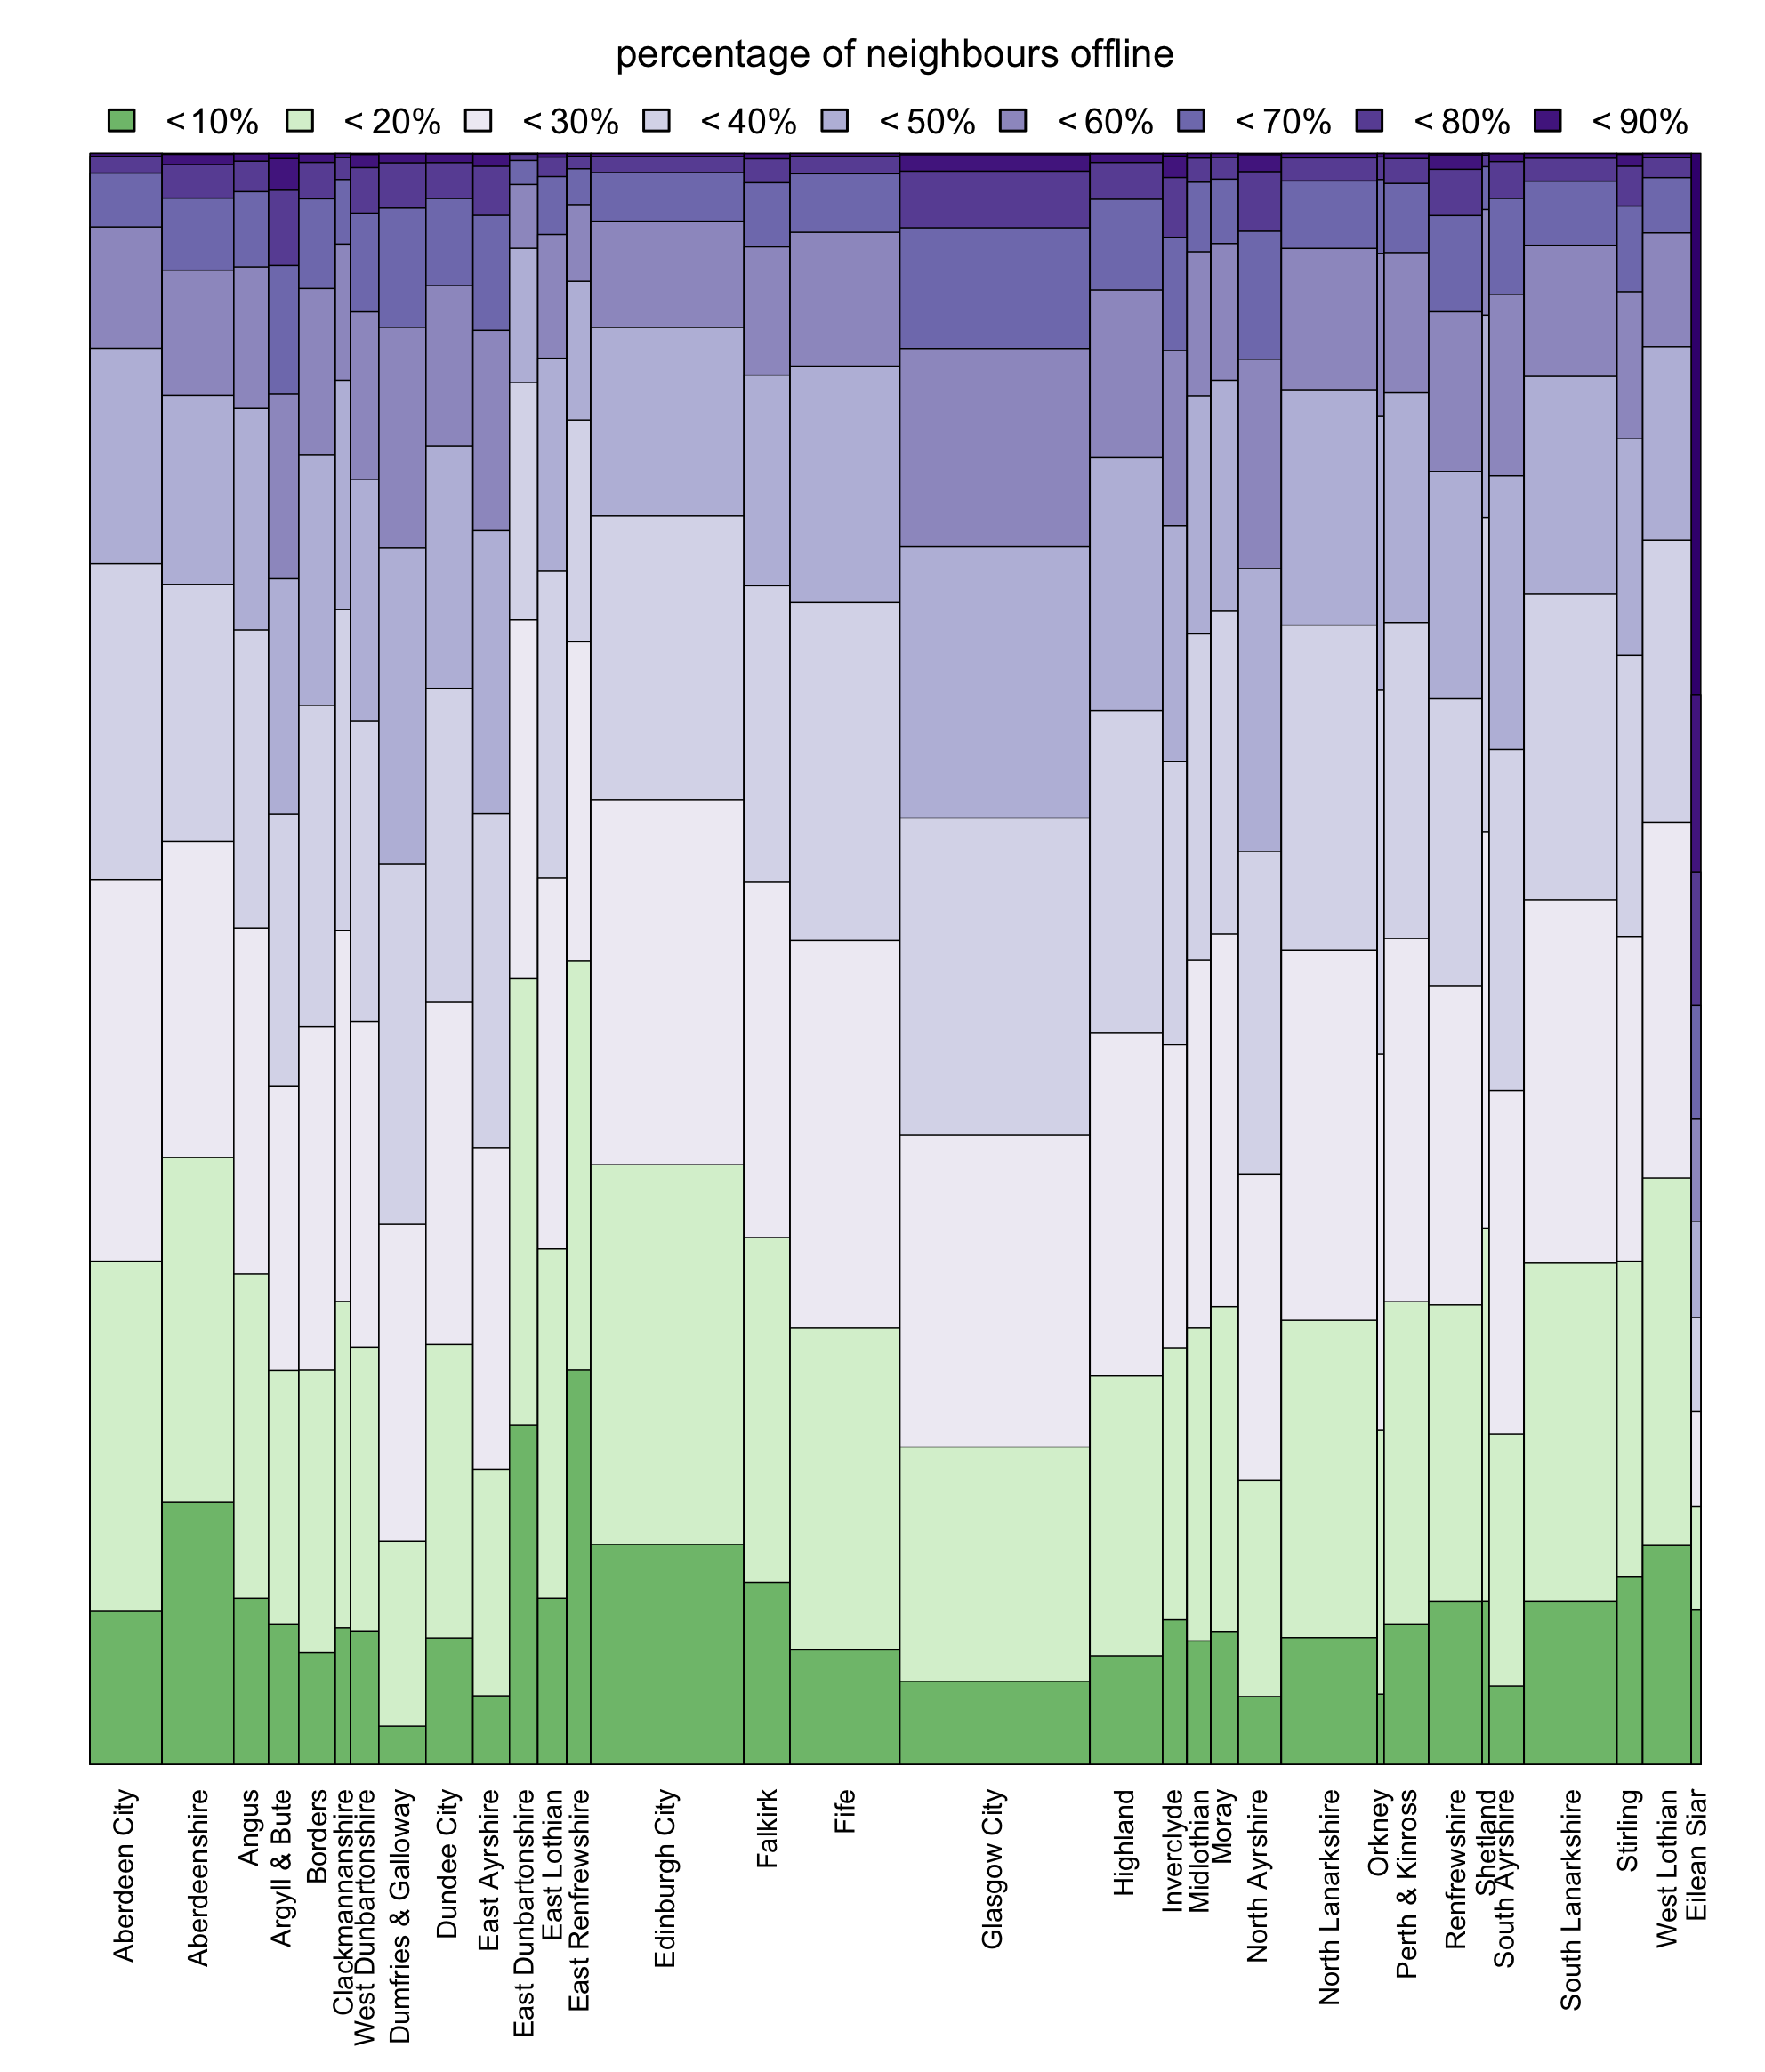
The square in Figure III.3, the diagram on the left, represents all households in Scotland. Each Local Authority area is represented by a column whose width is proportional to the number of households it contains. This column is split into bands, to show the distribution of inclusion/exclusion within the Local Authority area.
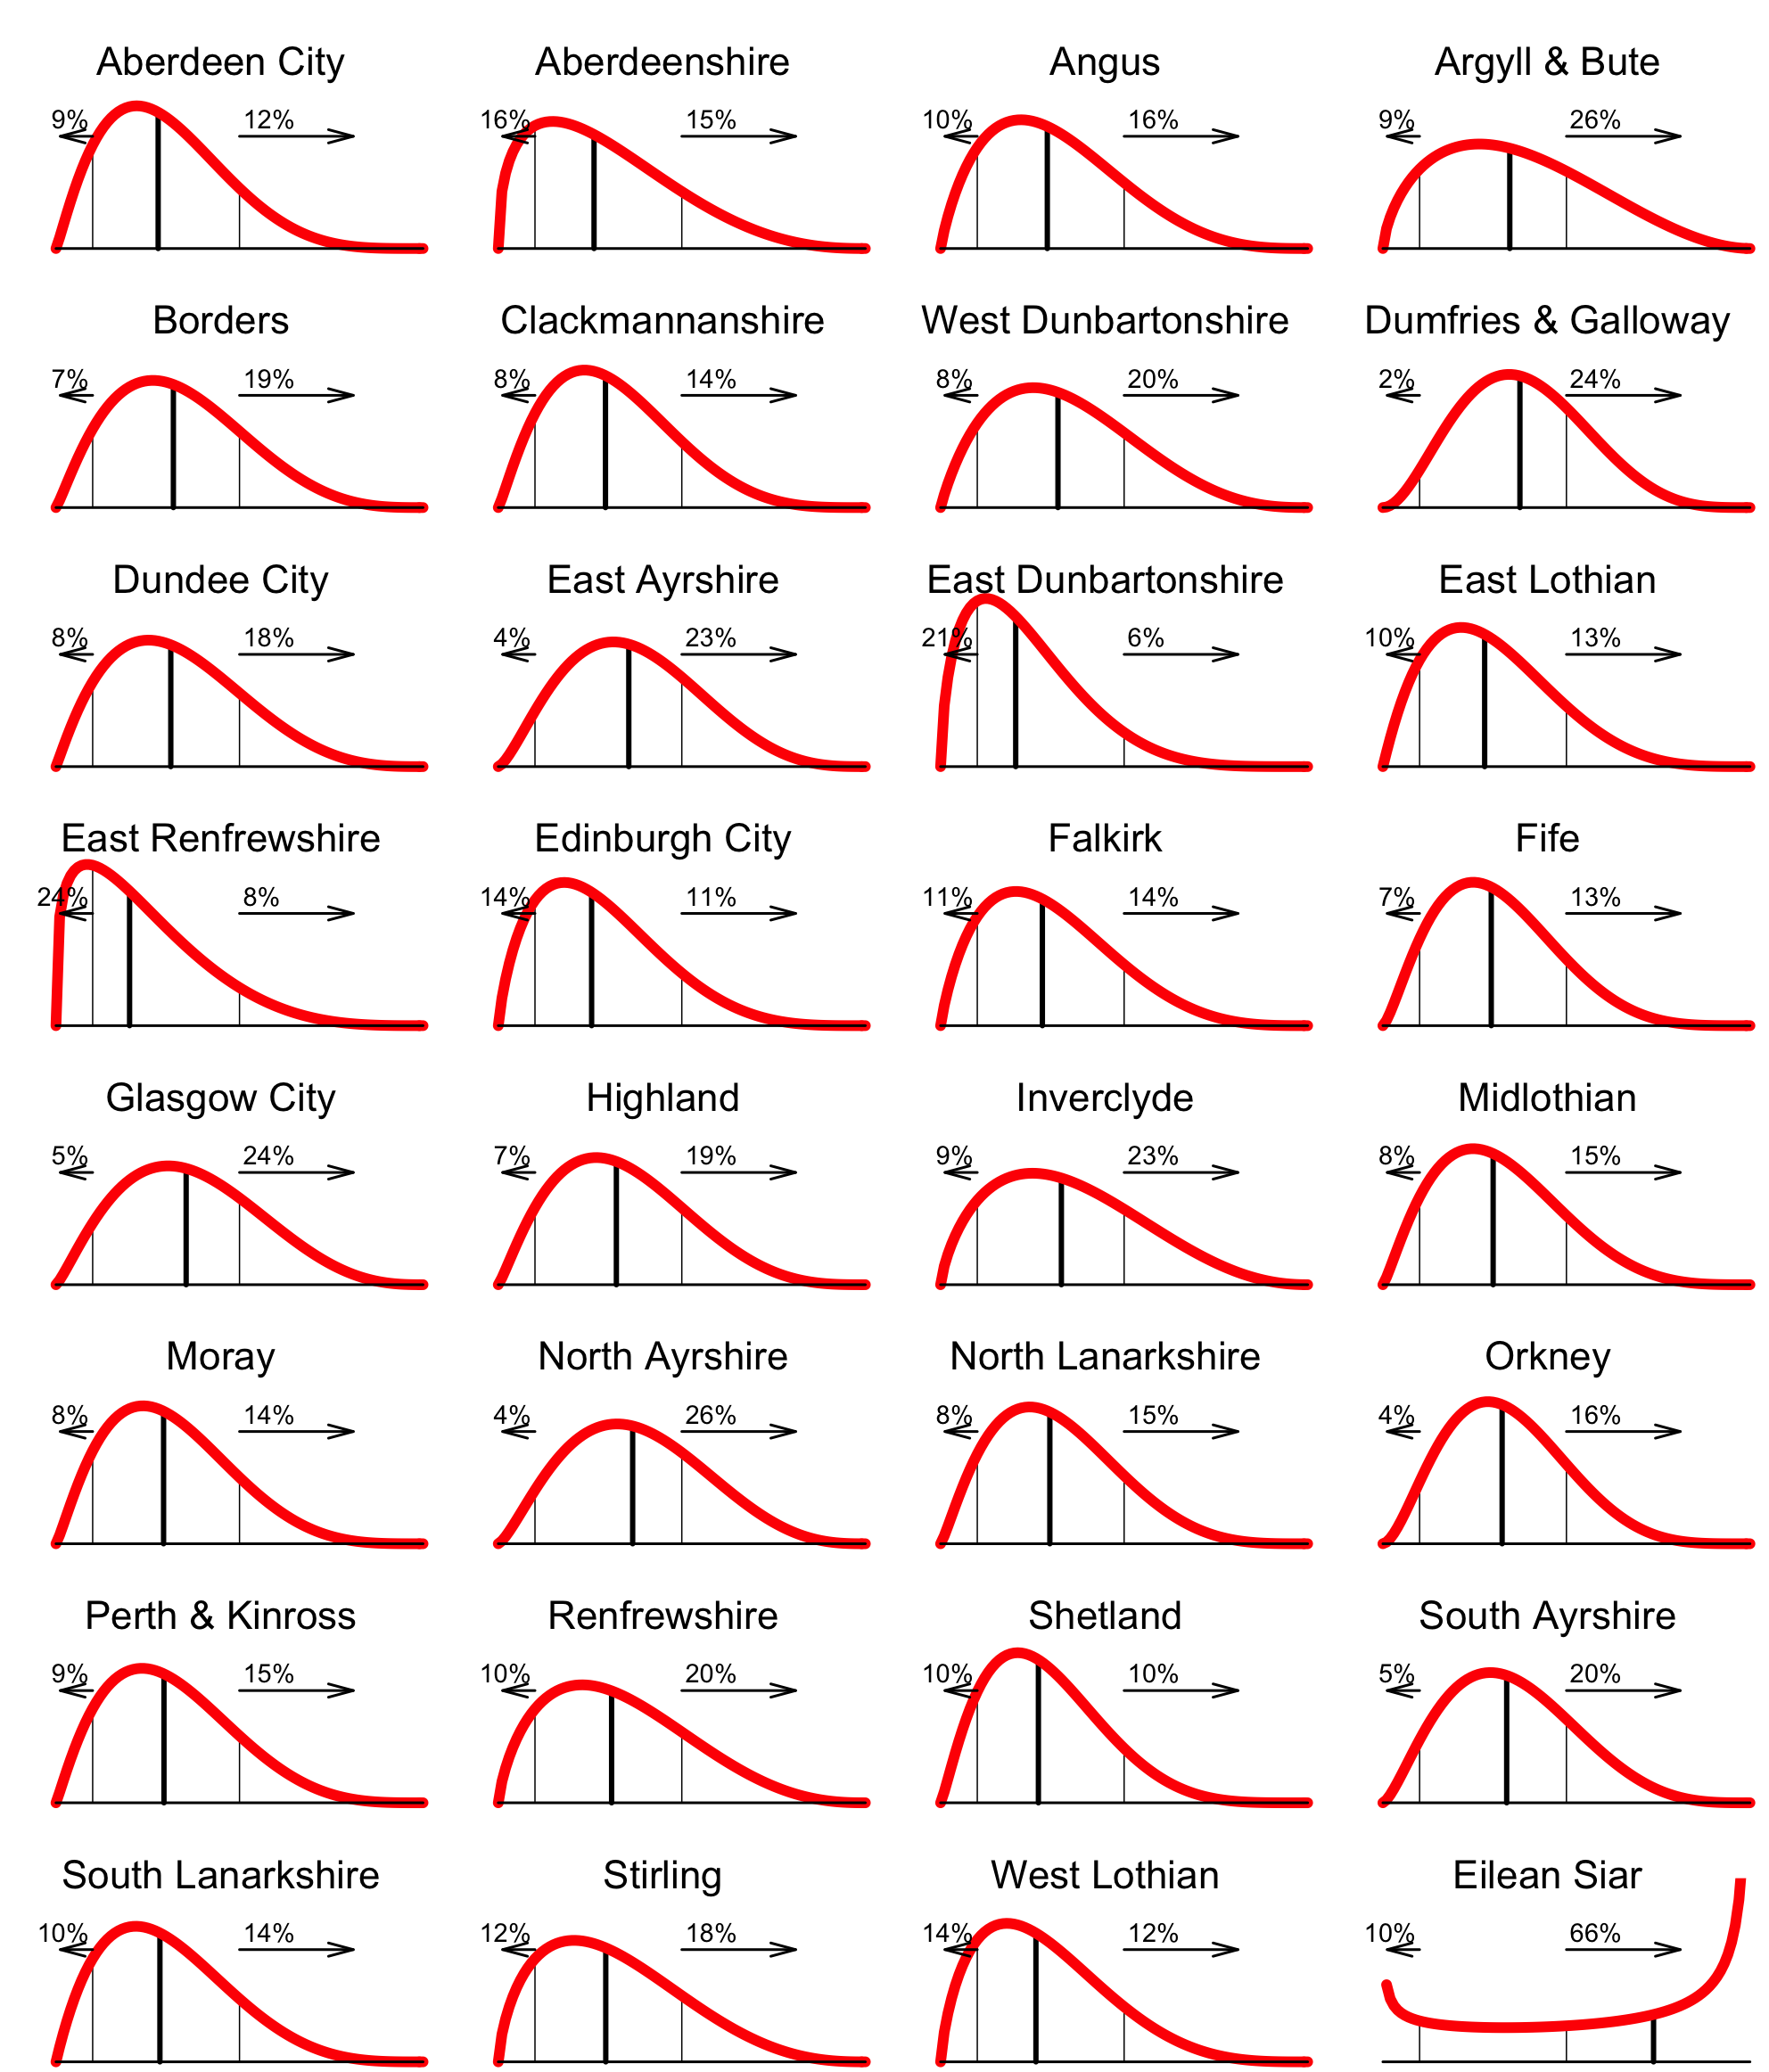
In the supplementary figure, to the right, we plot the density of each distribution directly, to give another presentation of the model. For each local Authority, we highlight the percentage of postcodes with a less than 10% chance of being offline, and the percentage in which most households are likely to be offline.


The model is produced using the following code:
pcCAglm <-
    vglm(formula =
         cbind(pmax(0, Household_Count-connections),
               pmin(Household_Count, connections))
         ~ CA,
         family = betabinomial.ab,
         data = model
         )
This gives a beta-distribution for each LA area, modelling the distribution, between postcodes, of the probability of being offline.
Eilean Siar is clearly a special case. The Ofcom data does not capture the Connected Communities network, which serves around 10% of the households in Eilean Siar.