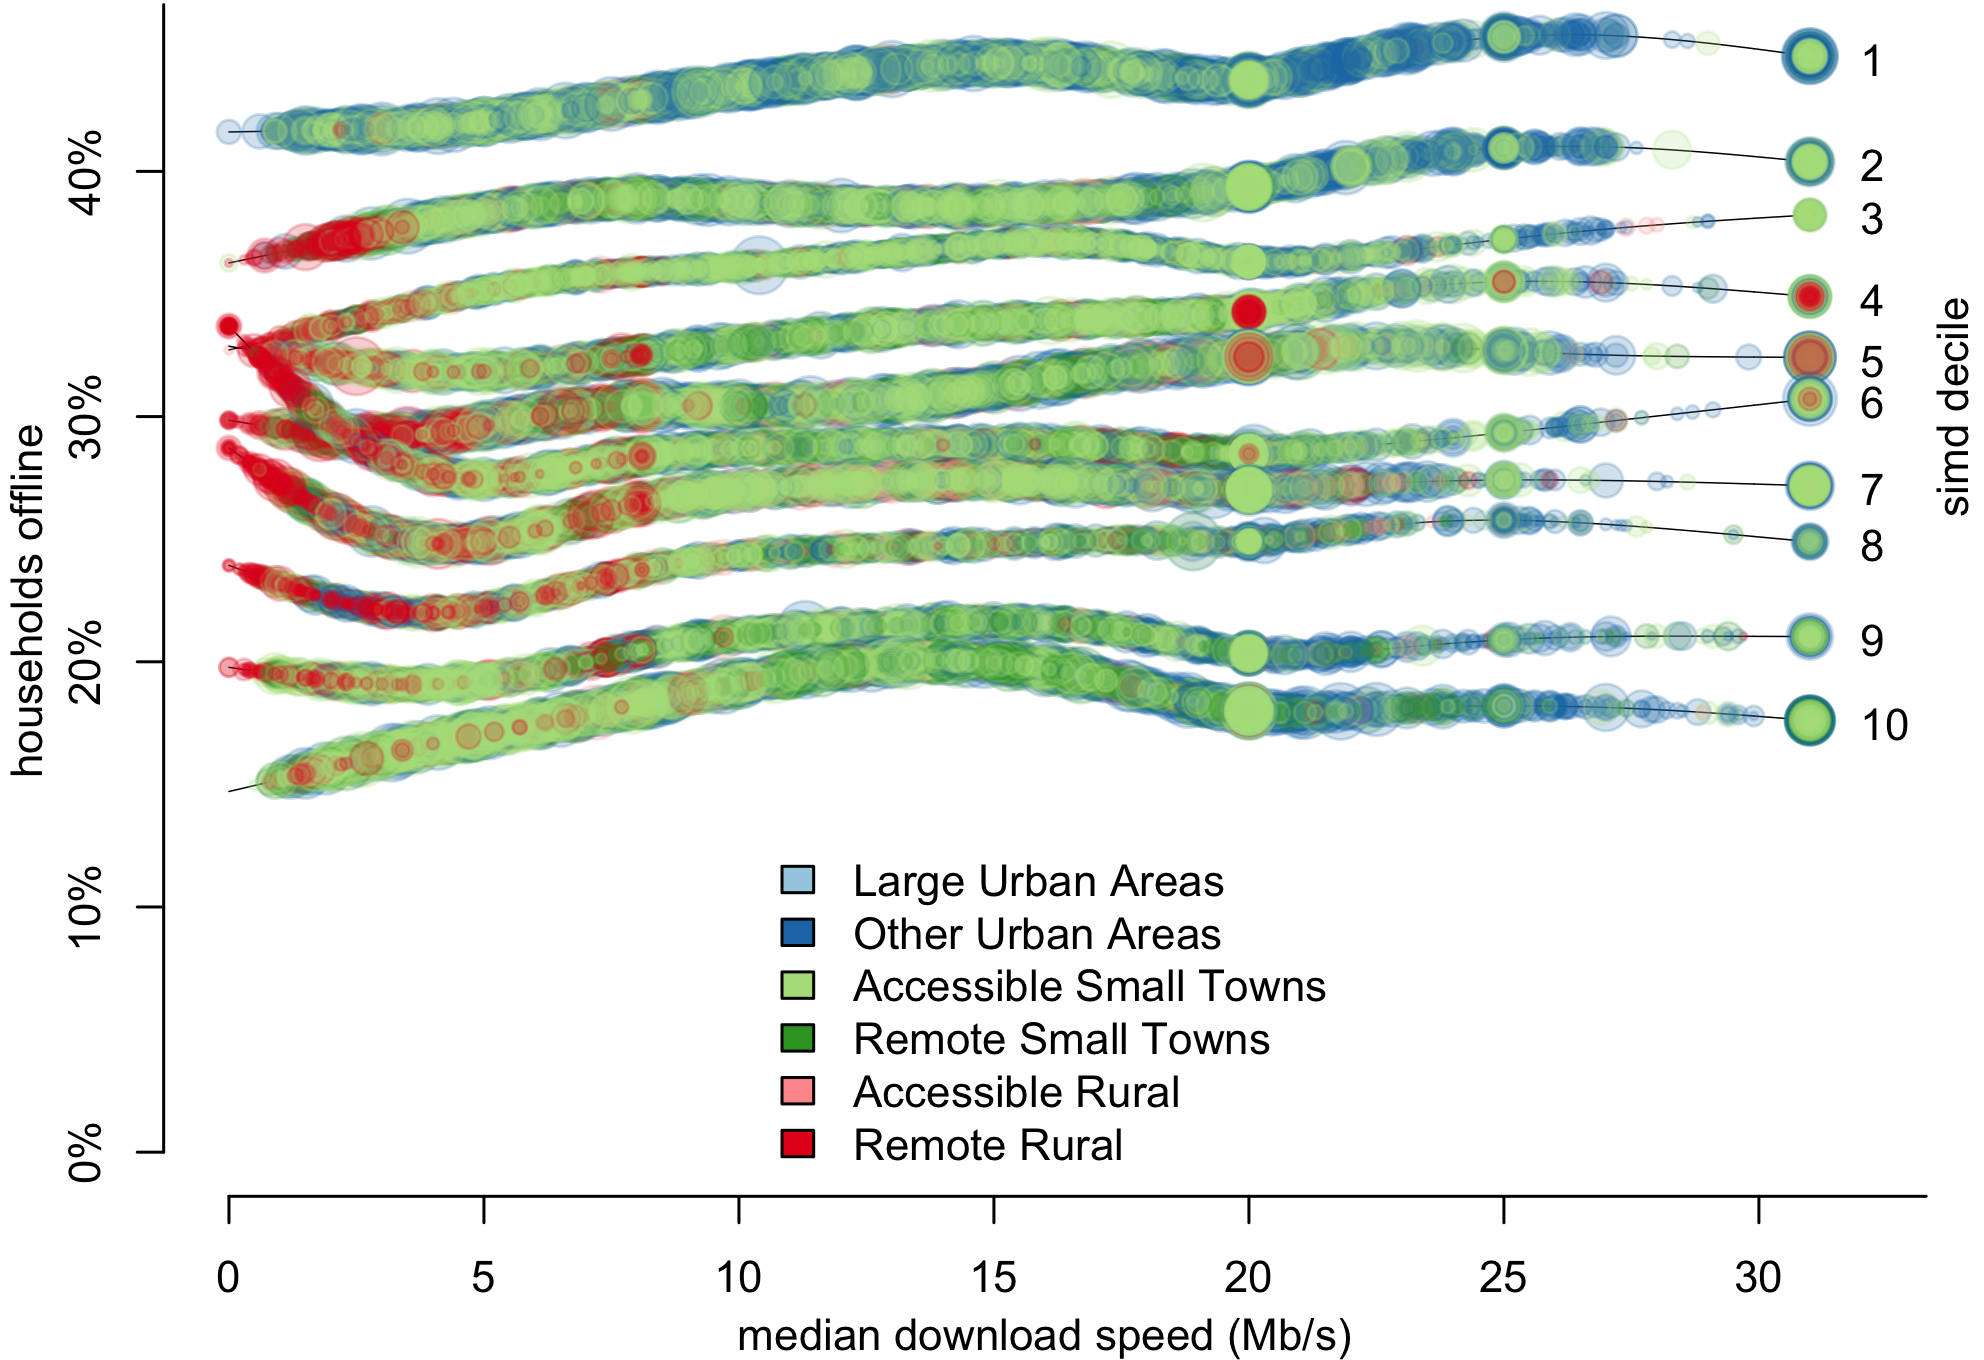
This figure shows how the proportion of households offline varies with median connection speed for each decile of (each 10% of the population ordered by) SIMD deprivation. Once we allow for the effects of deprivation, we can see that uptake generally increases where speeds are lower. In deciles 5-9 we see lower uptake where speeds are poor (< 4 Mb/s).

We use the model dataset,
and fit the two parameters of a beta-binomial distribution, as smooth
functions of isolation, using a
generalised additive model, provided by the VGAM package in R. The lines are drawn using the following code:
with(model,
     for (q in levels(decile)){
         m <- subset(model,
                     decile == q & !is.na(medspeed))
         speedgam <-
             vgam(formula =
                  cbind(offline,
                        connected)
                  ~ s(medspeed,df=4),
                  family = betabinomial.ab,
                  data = m,
                  trace = TRUE,
                  )
         lines(test$medspeed,
               predict(speedgam,
                       type="response",
                       newdata=test),
               lwd=0.5)
         symbols(m$medspeed,
                 predict(speedgam,type="response"),
                 circles=sqrt(m$Household_Count),
                 inches=0.1,
                 fg=alpha(ur6pal[m$UrbRur6_2011_2012],0.2),
                 bg=alpha(ur6pal[m$UrbRur6_2011_2012],0.2),
                 add=T)
         text(32,
              predict(speedgam,
                      type="response",
                      newdata=data.frame(medspeed=31)),
              labels= c(q),adj=c(0,0.6))
     }
     )