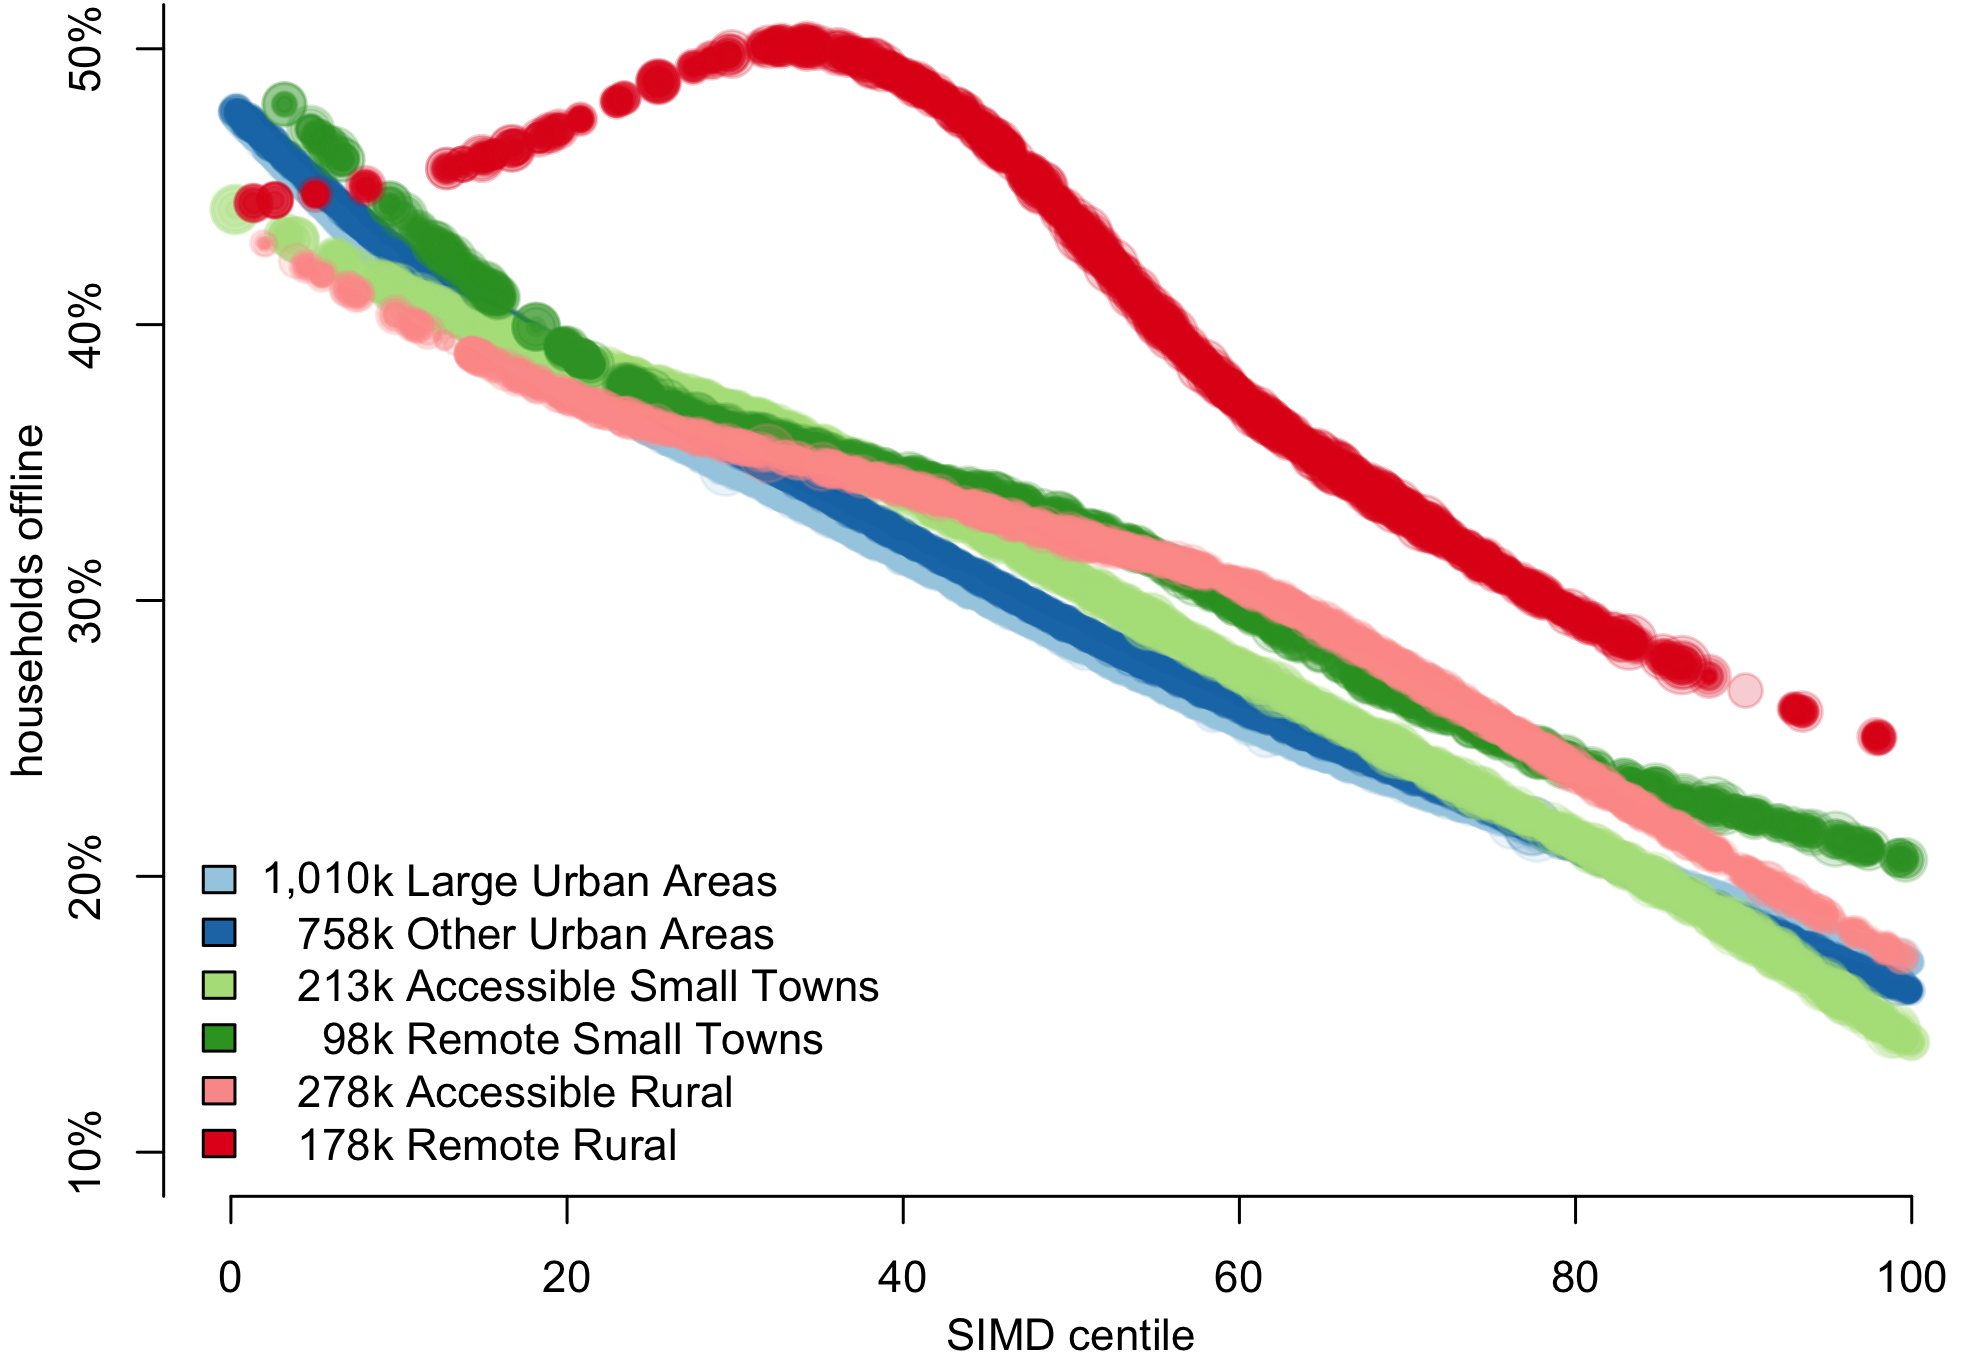
This figure shows how the proportion of households offline varies with SIMD deprivation across six geographies of the Scottish Government's UR6 classification. The key also gives the number of households included in each geography.

Across five of the six different geographies, the variation is remarkably similar. Those in more deprived areas are more likely to be offline. (The differences between these five are significant, but not large.)
The exception is the red line. In general, households in remote rural areas are more likely to be offline. We again see that the least deprived households are least likely to be offline, but there is also evidence that some of those in the most deprived third are under strong pressure to go online.
We use the model dataset,
and fit the two parameters of a beta-binomial distribution, as smooth
functions of isolation, using a
generalised additive model, provided by the VGAM package in R. The lines are drawn using the following code
for (i in 1:6){
    m <- subset(model,UrbRur6_2011_2012 == i)
    simdgam <-
        vgam(formula =
             cbind(offline,
                   connected)
             ~ s(simd),
             family = betabinomial.ab,
             data = m,
             trace = TRUE,
             )
    p <- exp(predict(simdgam))
    symbols(m$simd,
            qbeta(0.5, shape1=p[,1],shape2=p[,2]),
            circles= sqrt(pmax(m$Household_Count , m$connections)),
            fg=alpha(ur6pal[i], 0.2),
            bg=alpha(ur6pal[i], 0.2),
            inches= 0.1,
            add=T)
}